India Consumption Data
Understand India's "electronic" spending. Interact with data from April 2018 till date, on UPI transactions and volumes. Credit and Debit card transactions and volumes.
I've wanted to graph out India's "electronic" spend for while. So this includes the following
- Credit card spend (At PoS and Online)
- Debit card spend (At PoS and Online)
- Debit card withdrawals (How much is taken out in cash from ATM's and spent in the cash economy)
- UPI spend 🚀
The data is from the RBI and NPCI.
How was this put together?
I've put more details at the bottom of this post, but basically I pulled raw data from the RBI and NPCI. Did some processing in Excel Power Query. Made the visualizations in Tableau. And embedded these graphs.
In reality, the data part was the hardest. I thought it would be a days' work, to prep everything. But it took me an embarrassing number of DAYS instead. That's because the data quality was pretty bad. Details on how I dealt with this later.
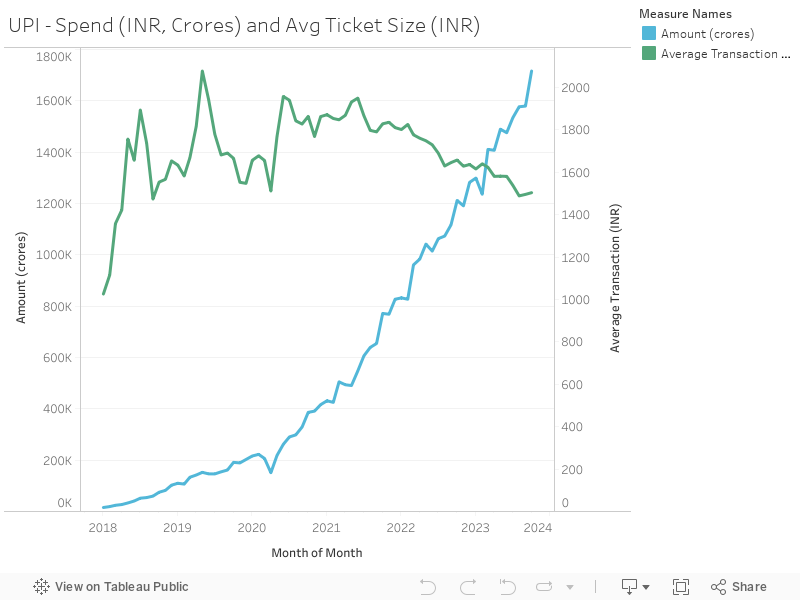
Rise of UPI
UPI transactions in September 2023 were 1.58 Lakh Crore INR. But as the volume goes up, the ticket size (seen below) keeps dropping. UPI is being used by an increasing number of people, clearly. And for a variety of smaller transactions, which pushes the average down.
Any guesses when it'll stabilize?
And it would be good to see unique monthly transactor data from NPCI.
akash.gg Newsletter
Join the newsletter to receive the latest updates in your inbox.